Several phases
Many datasets contain different atomic structures, which should be processed separately in different sublattices. For example precipitates in an Aluminium matrix.
>>> %matplotlib widget
>>> import atomap.api as am
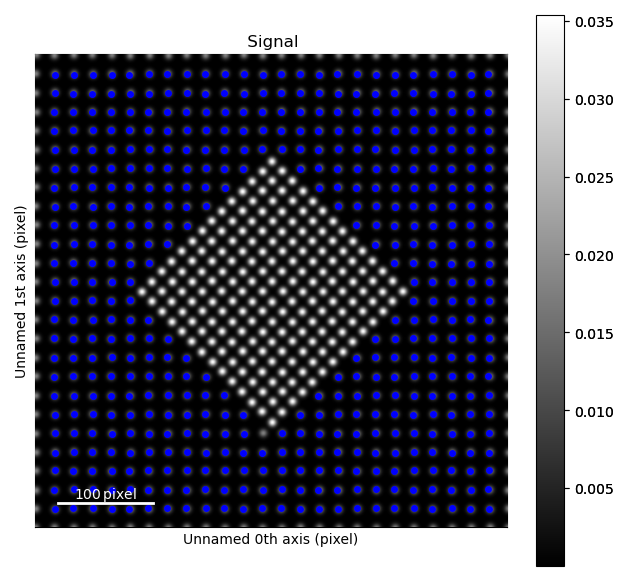
>>> s = am.dummy_data.get_precipitate_signal()
>>> s.plot()
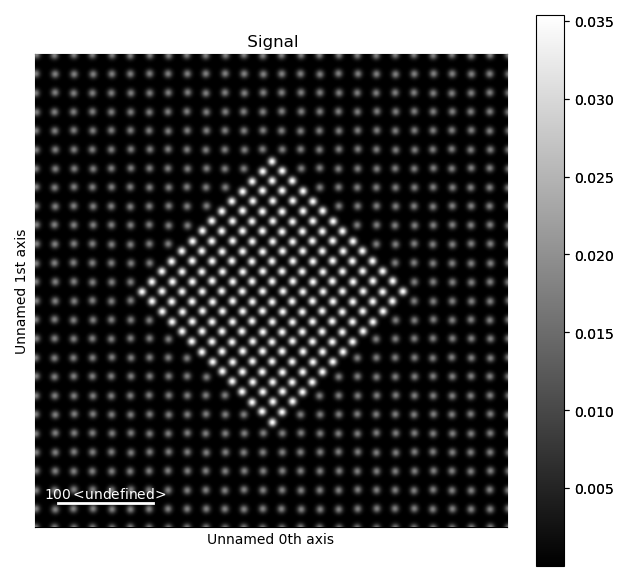
Due to the different structures, we want to process the precipitate (in the centre) and the matrix separately.
The easiest way of doing this is using the select_atoms_with_gui() function.
Firstly, find all the atom positions:
>>> atom_positions = am.get_atom_positions(s, 8)
Precipitate
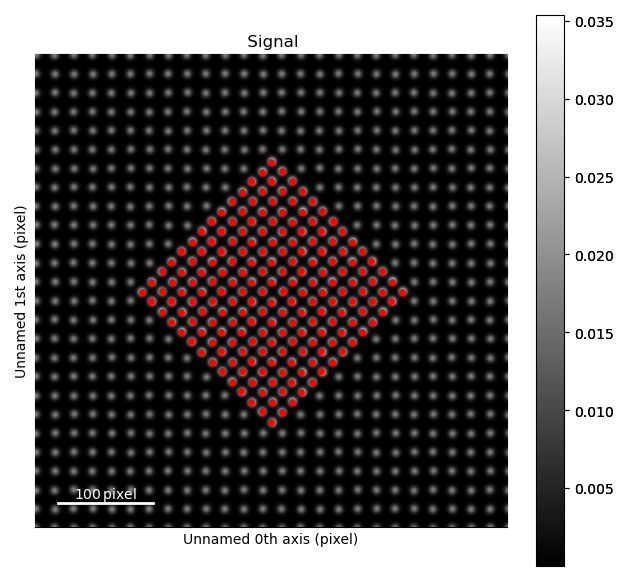
Then select the precipitate with select_atoms_with_gui():
>>> atoms_precipitate = am.select_atoms_with_gui(s, atom_positions)
The region can also be selected non-interactively, by using the verts parameter.
See Selecting atoms with GUI for an example of this.
We use this subset of atoms to create a sublattice
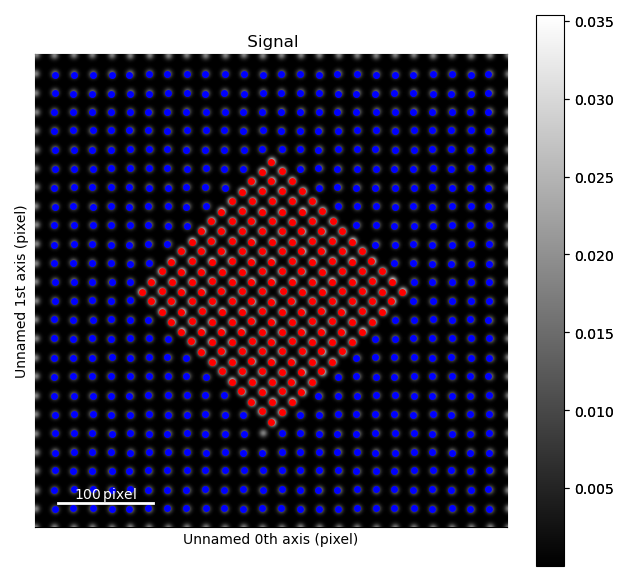
>>> sublattice_p = am.Sublattice(atoms_precipitate, s)
>>> sublattice_p.plot()
Matrix
The atoms in the matrix is selected using the same function, but with invert_selection=True.
>>> atoms_matrix = am.select_atoms_with_gui(s, atom_positions, invert_selection=True)

We use this subset of atoms to create a sublattice for the matrix
>>> sublattice_m = am.Sublattice(atoms_matrix, s, color='blue')
>>> sublattice_m.plot()
These two sublattices can then be added to an Atom_Lattice object.
>>> atom_lattice = am.Atom_Lattice(s, sublattice_list=[sublattice_p, sublattice_m])
>>> atom_lattice.plot()
Analysing the sublattices
Intensity
Getting the intensity of the atomic columns can be done without doing any position refinement or other processing.
>>> i_points, i_record, p_record = atom_lattice.integrate_column_intensity()
>>> i_record.plot()
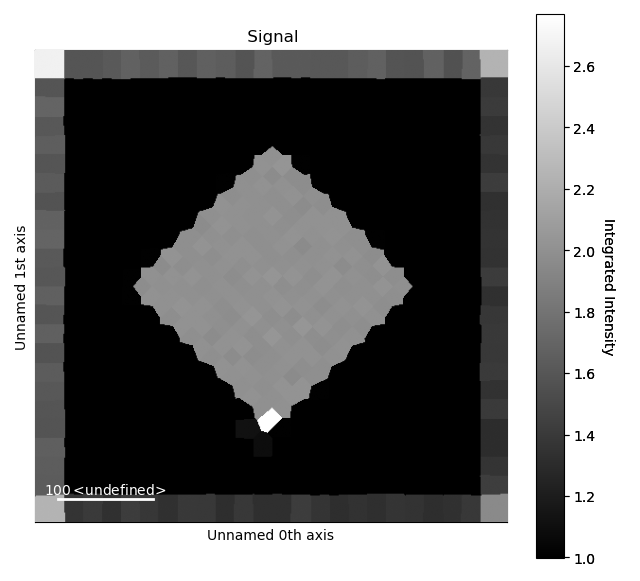
Note the higher intensity at the border of the image, which is due to the atoms at the edge of dataset not being identified as individual atoms.
So their intensity is added to the closest ones.
This effect can be reduced by using the max_radius parameter in integrate_column_intensity(), or by cropping the intensity output.
>>> i_record.isig[30:-30, 30:-30].plot()
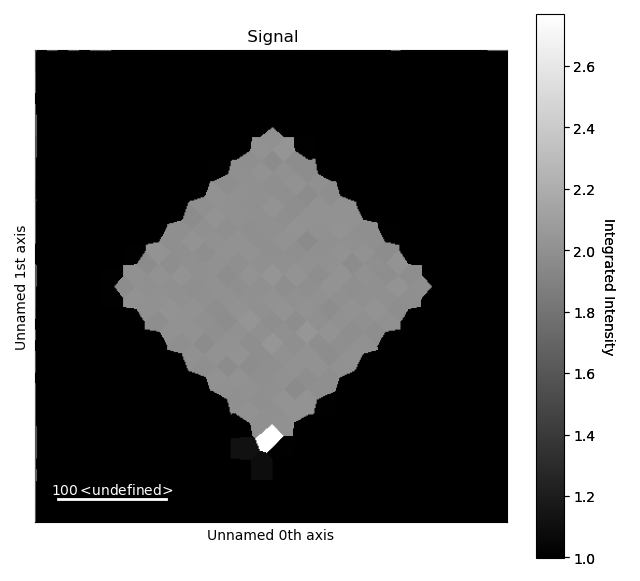
Where isig is a method for cropping HyperSpy signals.
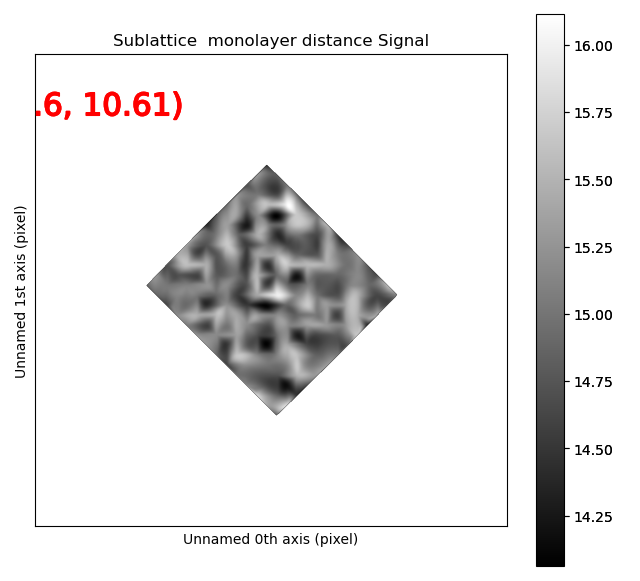
Distance between precipitate atoms
See Distance between monolayers for more information.
Run position refinements for the precipitate sublattice, firstly by finding the atomic planes, and then refining the positions.
>>> sublattice_p.construct_zone_axes()
>>> sublattice_p.refine_atom_positions_using_center_of_mass()
>>> sublattice_p.refine_atom_positions_using_2d_gaussian()
Visualize this for the first zone axis:
>>> za0 = sublattice_p.zones_axis_average_distances[0]
>>> s_mono0 = sublattice_p.get_monolayer_distance_map([za0])
>>> s_mono0.plot()