GUI functionality
Selecting atoms with GUI
Many datasets contain different atomic structures, which should be processed separately in different sublattices.
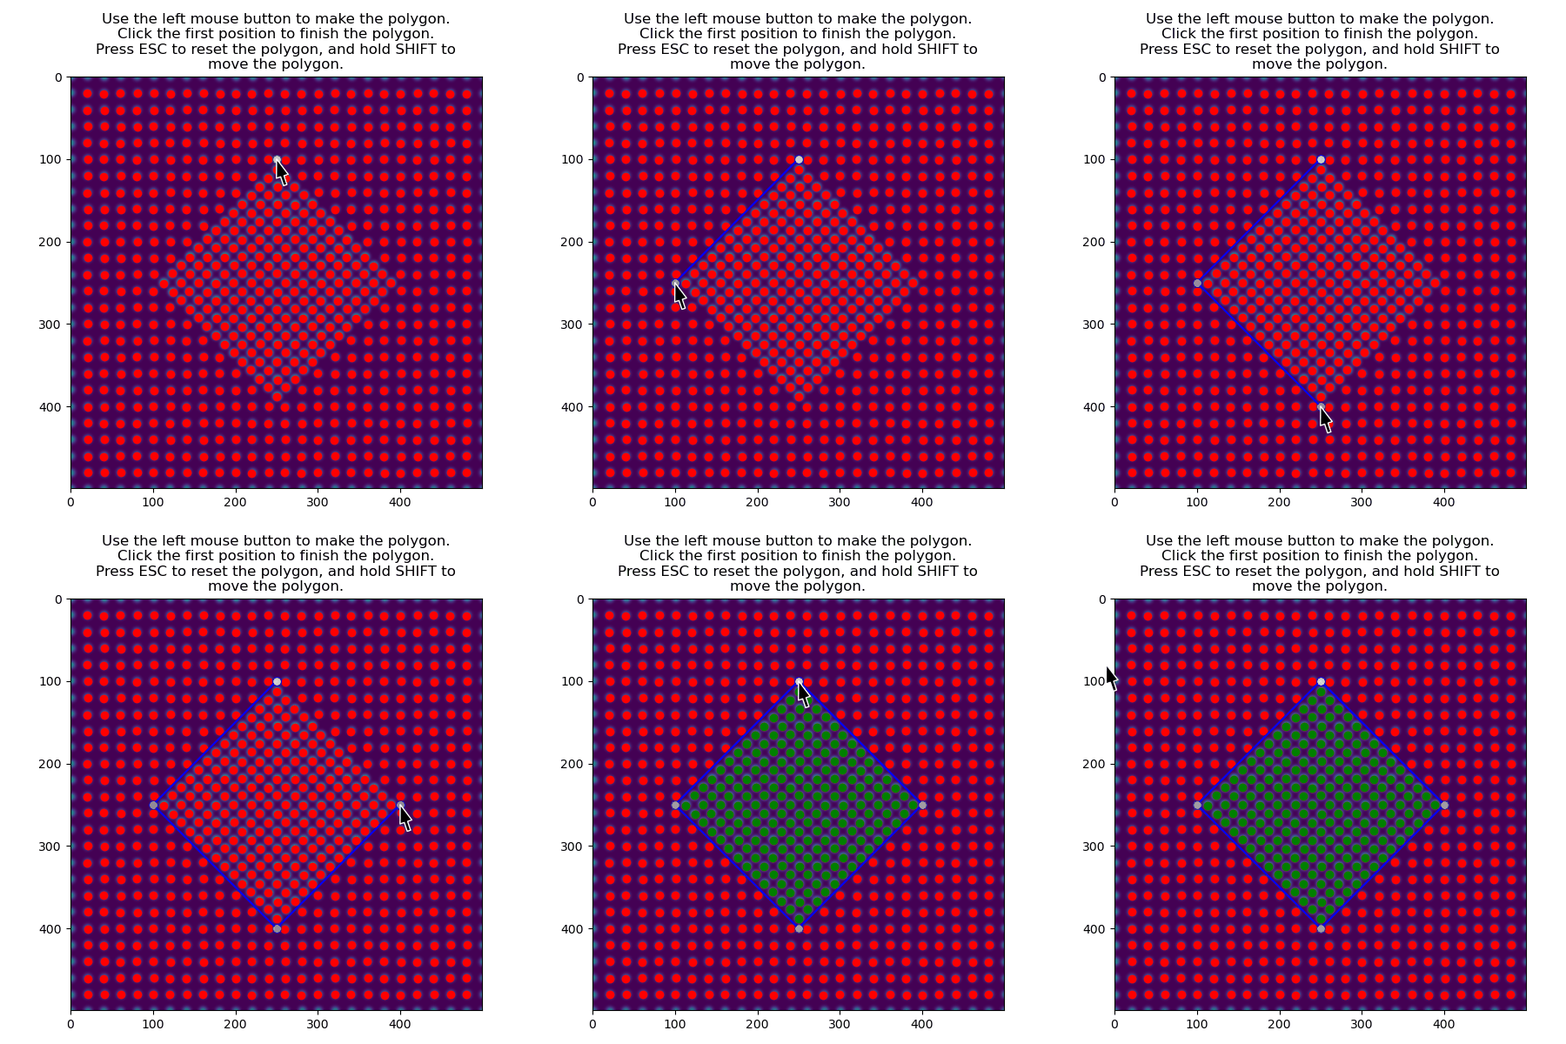
One way of separating them is using select_atoms_with_gui().
>>> %matplotlib widget
>>> import atomap.api as am
>>> s = am.dummy_data.get_precipitate_signal()
>>> atom_positions = am.get_atom_positions(s, 8)
>>> atom_positions_selected = am.select_atoms_with_gui(s, atom_positions)

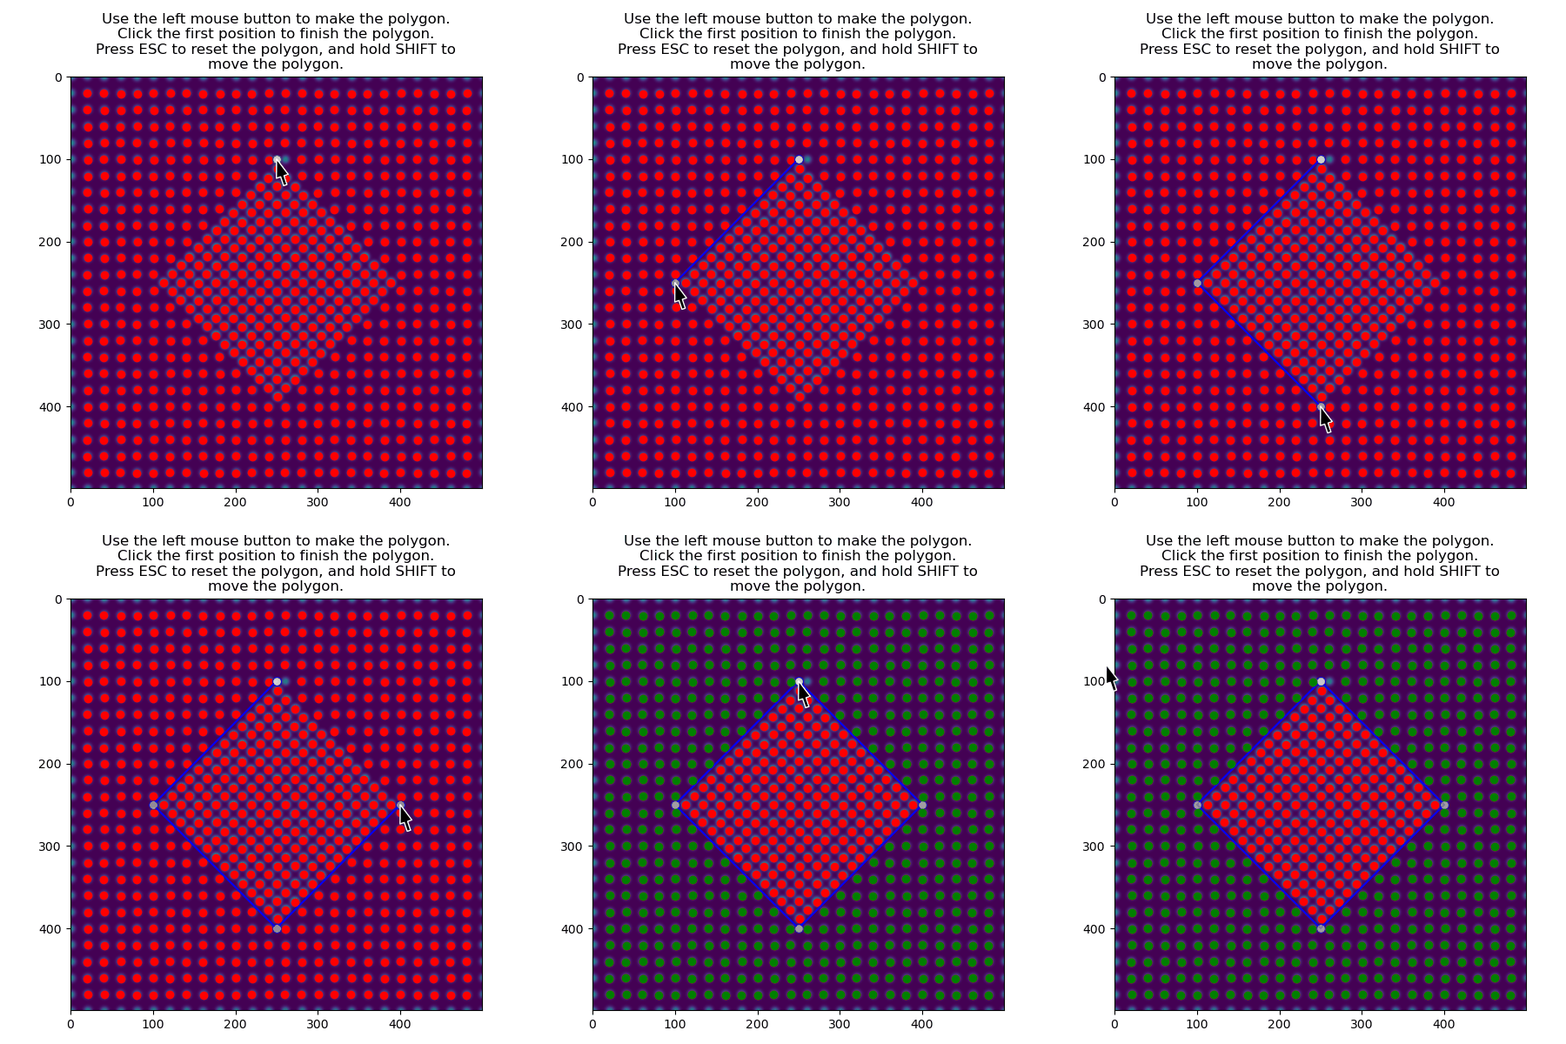
The selection can be inverted by using the invert_selection=True:
>>> atom_positions_selected = am.select_atoms_with_gui(s, atom_positions, invert_selection=True)

The function can also be used non-interactively via the verts parameter, which is useful when writing processing scripts:
>>> verts = [[250, 100], [100, 250], [250, 400], [400, 250], [250, 100], [-10, 80]]
>>> atom_positions_selected = am.select_atoms_with_gui(s, atom_positions, verts=verts)
For an example of how to use this function to analyse a precipitate/matrix system, see Several phases.
Adding atoms using GUI
For most cases the majority of the atoms is found with automatic peak finding using get_feature_separation() and get_atom_positions().
However, for some datasets there might be either missing or extra atoms.
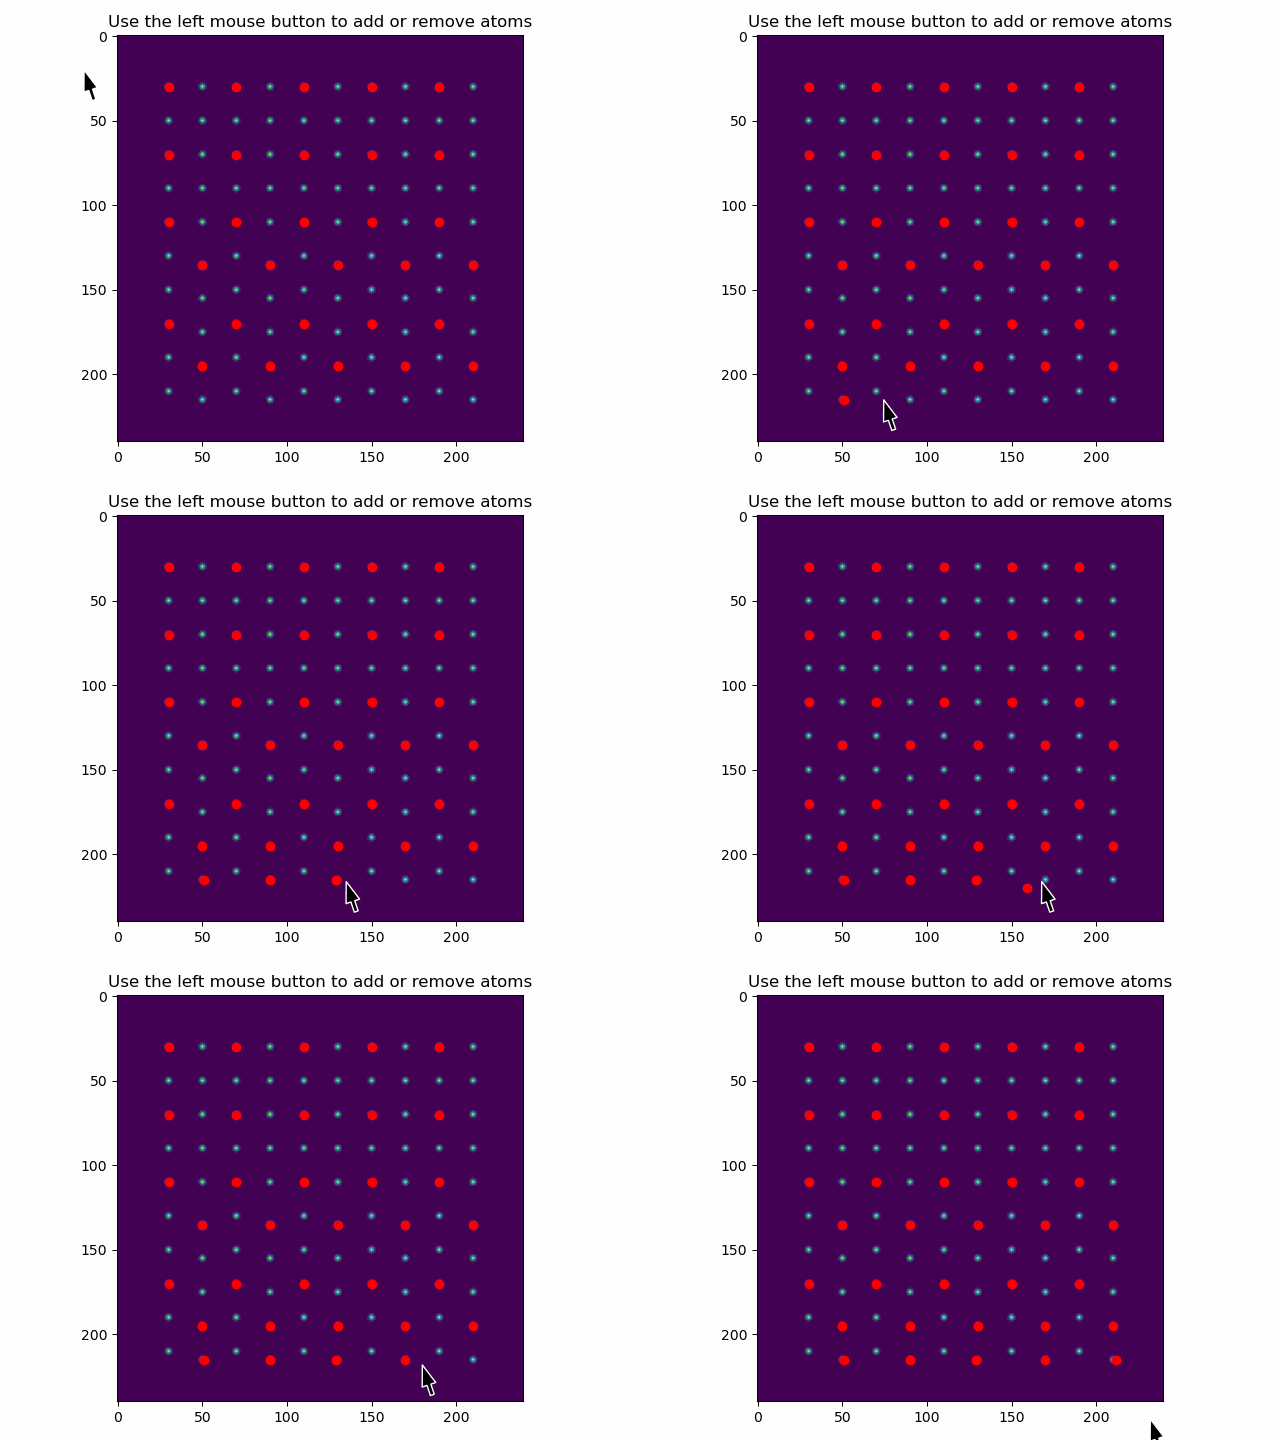
These can be added or removed using add_atoms_with_gui().
This function opens up a window showing the datasets, where atoms can be added or removed by clicking on them with the mouse pointer.
>>> %matplotlib widget
>>> s = am.dummy_data.get_distorted_cubic_signal()
>>> atom_positions = am.get_atom_positions(s, 25)
>>> atom_positions_new = am.add_atoms_with_gui(s, atom_positions)

After having added or removed the atoms, atom_positions_new is used to make a sublattice object:
>>> sublattice = am.Sublattice(atom_positions_new, s)
add_atoms_with_gui() can also be used without any initial atoms:
>>> atom_positions = am.add_atoms_with_gui(s)
If the atoms in the dataset are too close together, distance_threshold is used to decrease the distance for removing an atom.
>>> atom_positions = am.add_atoms_with_gui(s, distance_threshold=2)
If some of the atoms have much lower intensity than the others, the image can be shown in a log plot with the parameter norm='log'.
>>> atom_positions = am.add_atoms_with_gui(s, norm='log')
Toggle atom refine
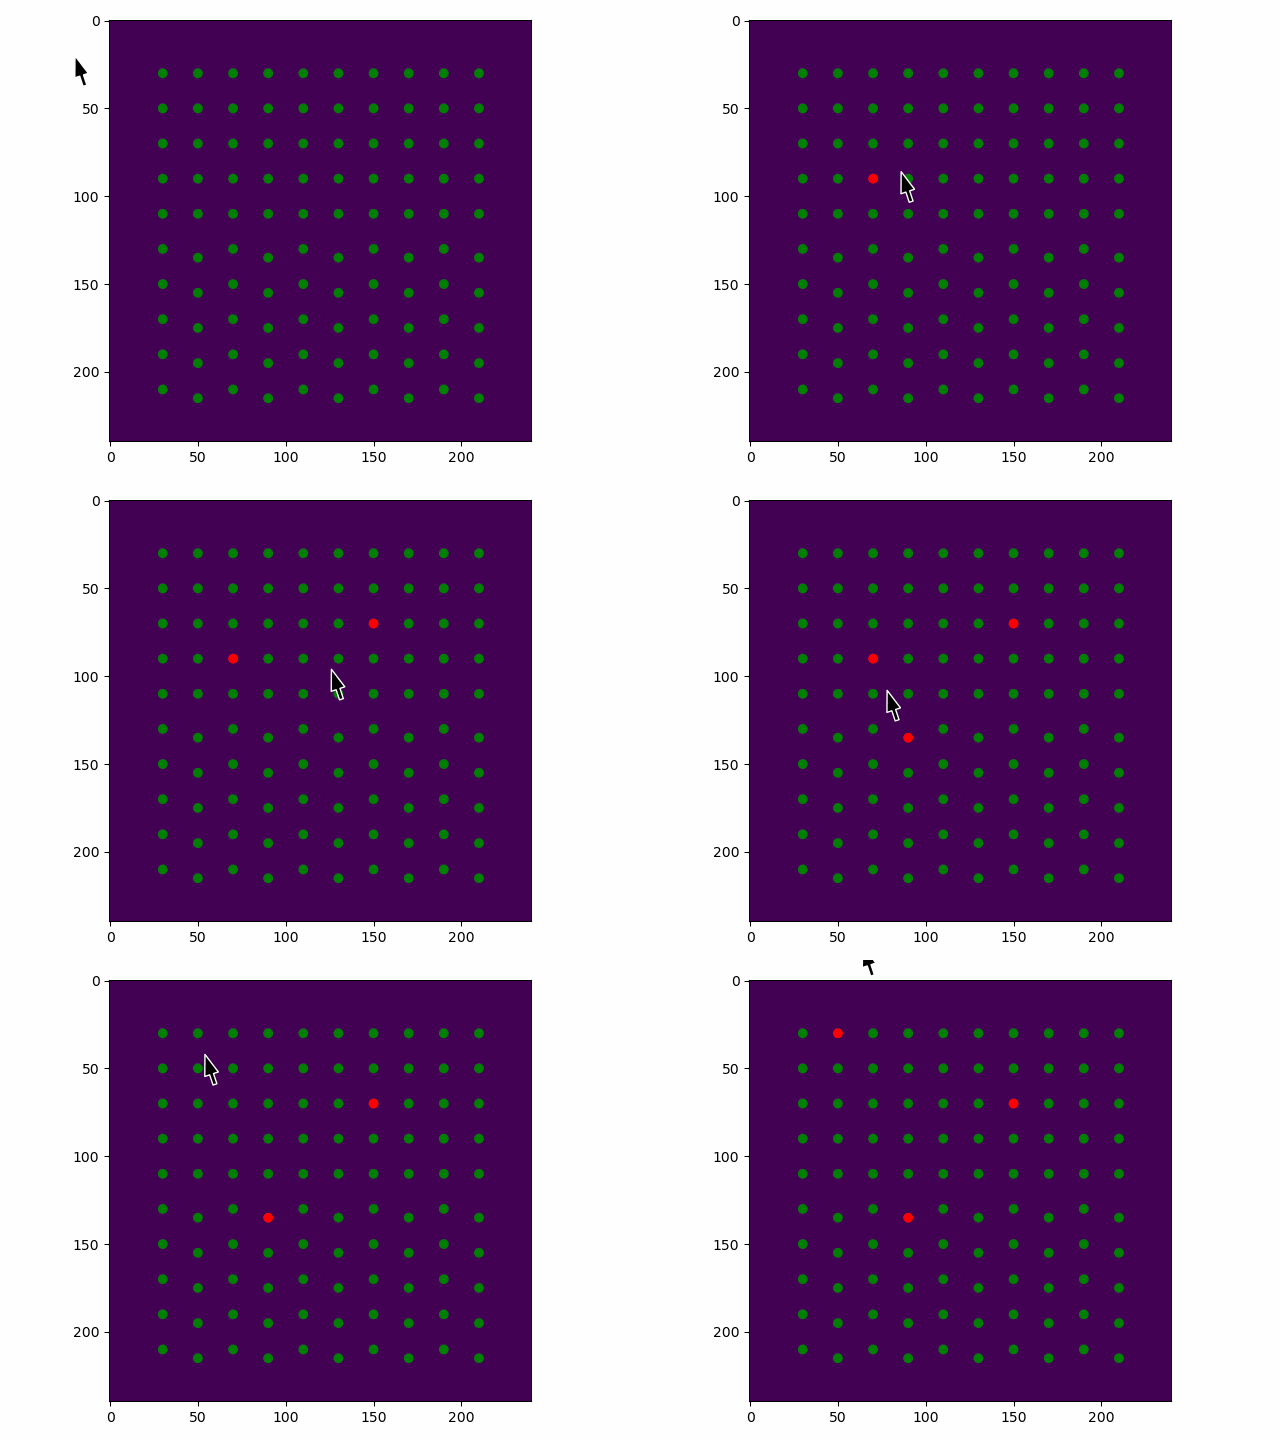
To disable position refining or fitting of atoms in a sublattice, use toggle_atom_refine_position_with_gui():
>>> %matplotlib qt
>>> sublattice = am.dummy_data.get_distorted_cubic_sublattice()
>>> sublattice.toggle_atom_refine_position_with_gui()
Use the left mouse button to toggle refinement of the atom positions. Green: refinement. Red: not refinement.

This can also be set directly through the refine_position property in the Atom_Position objects.
>>> sublattice.atom_list[5].refine_position = False