Quantify scan distortions
Distortions in scanning transmission electron microscopy data comes from a large number of sources, which spans a wide range of different frequencies.
One way of measuring this, is looking at the distance between atomic columns, by for example using get_monolayer_distance_map().
Another method is looking at how distorted the atomic columns themselves are.
This is done using estimate_local_scanning_distortion().
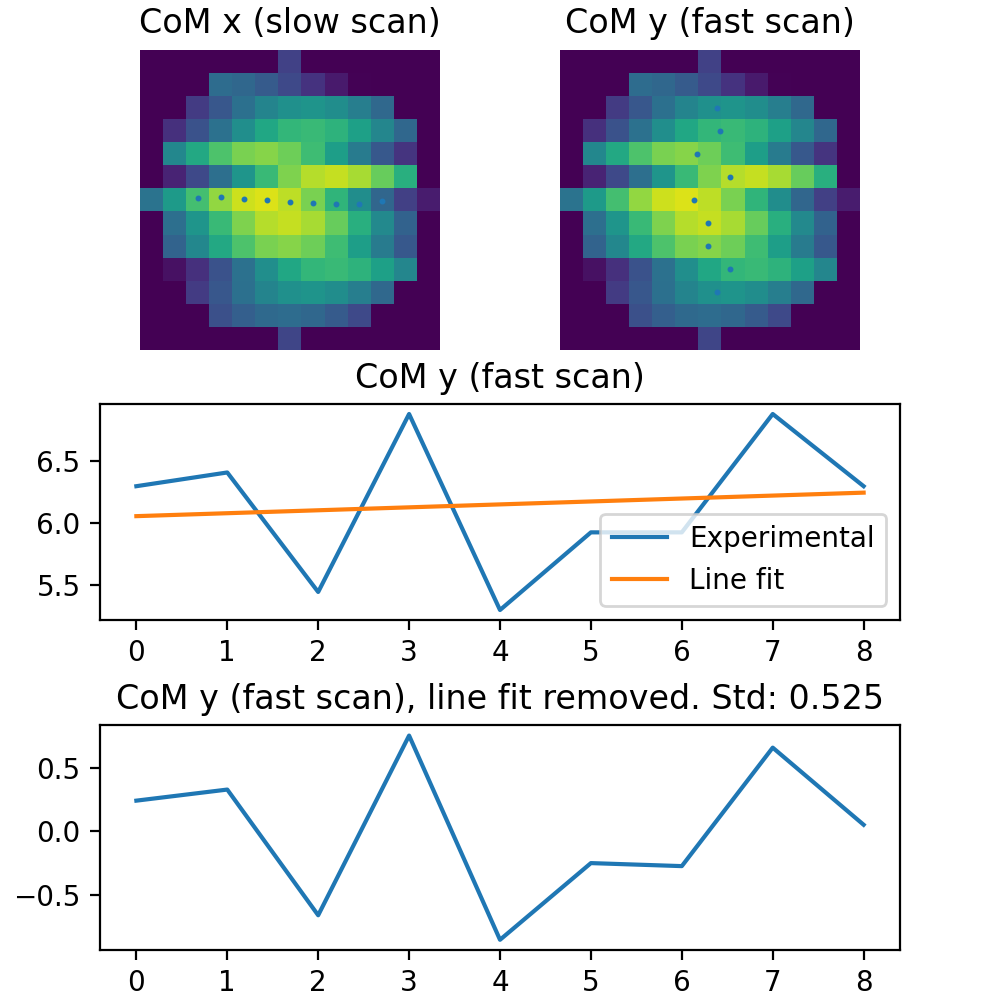
Here, we assuming that the atomic columns has a symmetrical shape, like Gaussian or Lorentzian. The distortion is calculated by getting the image_data around the atom, given by the radius parameter. This gives a square cropped version of the image, where the region outside the radius is masked. For each line in the horizontal direction, the center of mass is found. This gives a list of horizontal positions as a function of the vertical lines. To remove the effects like astigmatism and mistilt a linear fit is fitted to this list of horizontal positions. This fit is then subtracted from the horizontal position. The distortion for the vertical lines is then calculated by getting the standard deviation of this list of values. Getting the horizontal distortions is calculated in a similar fashion, but with a list of vertical positions as a function of the horizontal lines.
See the below image for a visualization of this.
>>> import atomap.api as am
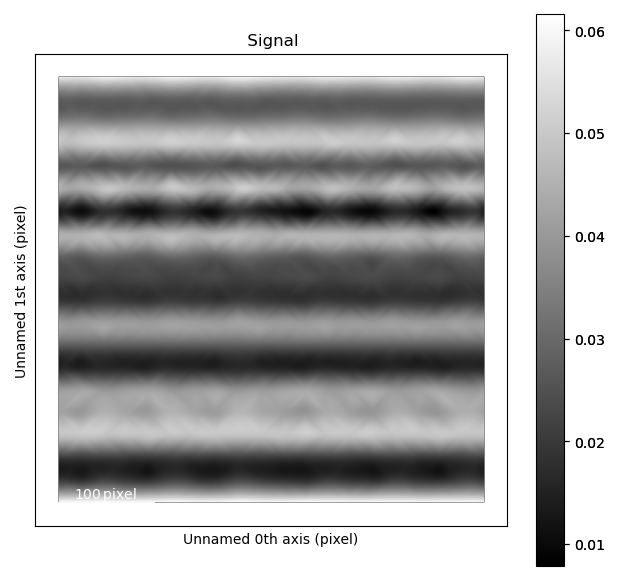
>>> sublattice = am.dummy_data.get_scanning_distortion_sublattice()
>>> sublattice.plot()
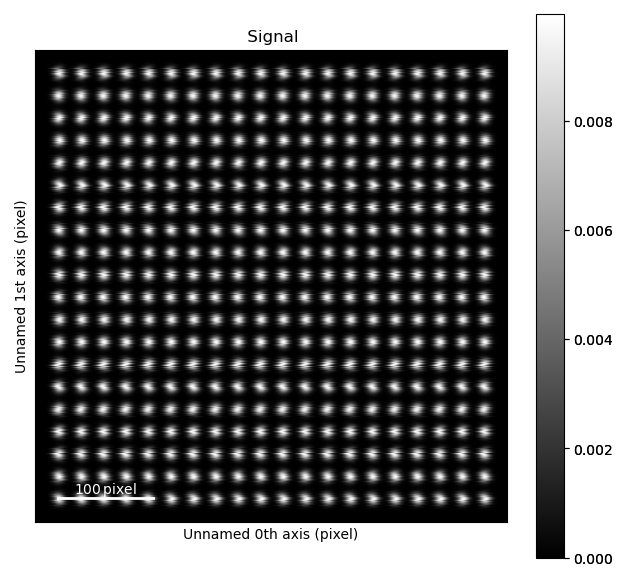
>>> s_x, s_y, avg_x, avg_y = sublattice.estimate_local_scanning_distortion()
>>> s_x.plot()