Dumbbell lattice
There is also a notebook in the Atomap-demos repository: https://github.com/atomap-dev/atomap-demos/blob/main/dumbbell_example_notebook/dumbbell_example.ipynb
Analysis of atomic resolution images can be tricky if the atoms are too close together, leading to overlap. For these images, several atomic columns must be fitted simultaneously. However, fitting many 2-D Gaussians over a large at the same time will be significantly slower than fitting a couple. So in these cases, only the atoms which overlap should be fitted simultaneously.
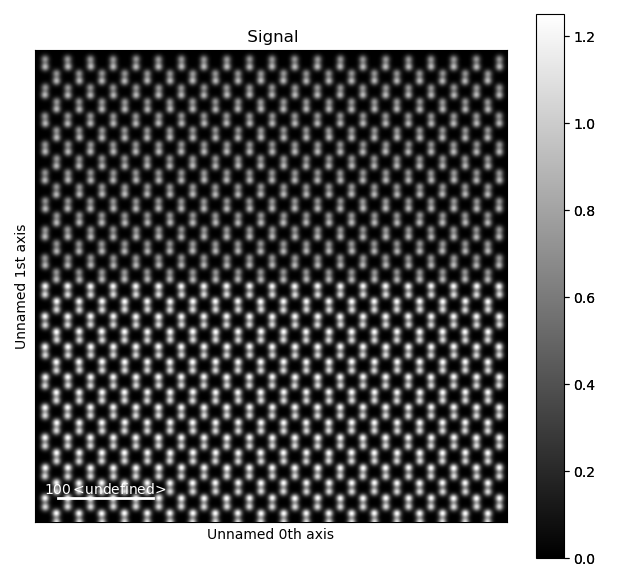
A very common example of this is dumbbells, often seen in zincblende structures such as Si or GaAs. Processing and analysing these require some specialized functions, which will be shown here. To do this, we’ll use a dataset emulating a zincblende heterostructure.
>>> import atomap.api as am
>>> s = am.dummy_data.get_dumbbell_heterostructure_signal()
>>> s.plot()
Dumbbell vector
The first step is finding the “dumbbell vector”, which is the distance and direction between the atoms in the dumbbells.
We do this by getting all the atomic positions, firstly by finding an appropriate feature separation.
As the atoms in the dumbbells are typically pretty close together, we use a low separation_range between 2 and 6.
>>> s_peaks = am.get_feature_separation(s, separation_range=(2, 6), show_progressbar=False)
>>> s_peaks.plot()
The first separation, 2, seems to work well here.
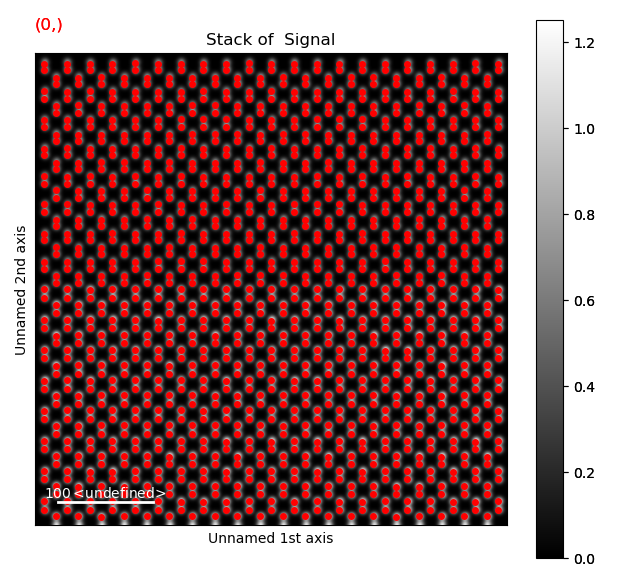
Use get_atom_positions() to get an array with all of these atomic positions.
>>> atom_positions = am.get_atom_positions(s, separation=2)
To find the dumbbell vector, these atom positions are passed to the find_dumbbell_vector() function:
>>> import atomap.initial_position_finding as ipf
>>> dumbbell_vector = ipf.find_dumbbell_vector(atom_positions)
Making the dumbbell lattice
Then the dumbbells themselves has to be found, by finding one atom in each of the dumbbells.
As these are further apart, we use a higher separation_range between 5 and 20.
>>> s_peaks = am.get_feature_separation(s, separation_range=(5, 20), show_progressbar=False)
>>> s_peaks.plot()
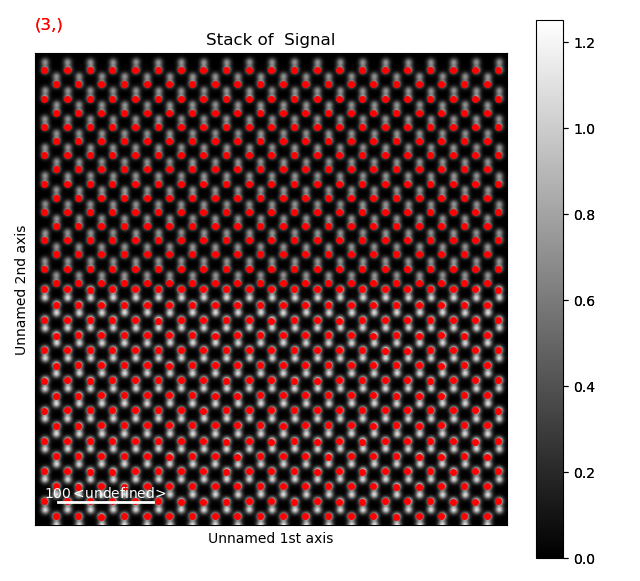
Here, the third separation, 8, seems to work well. Use this get the dumbbell_positions.
>>> dumbbell_positions = am.get_atom_positions(s, separation=8)
The dumbbell_vector and dumbbell_positions are then used to make a dumbbell_lattice, with the make_atom_lattice_dumbbell_structure() function:
>>> dumbbell_lattice = ipf.make_atom_lattice_dumbbell_structure(s, dumbbell_positions, dumbbell_vector)
>>> dumbbell_lattice.plot()
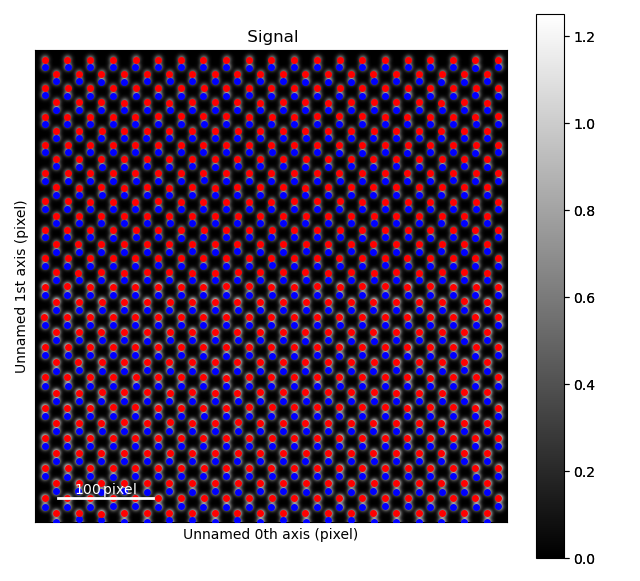
Due to the atom columns being too close together, we can’t use the standard refine methods, but rather have to use a special one which fits both atoms in the dumbbell at the same time: atomap.atom_lattice.Dumbbell_Lattice.refine_position_gaussian().
>>> dumbbell_lattice.refine_position_gaussian()
Analysing the image
There are several ways to analyse the image using the Dumbbell_Lattice object.
Many of these are shared with the Atom_Lattice class, examples of these are seen in Analysing atom lattices.
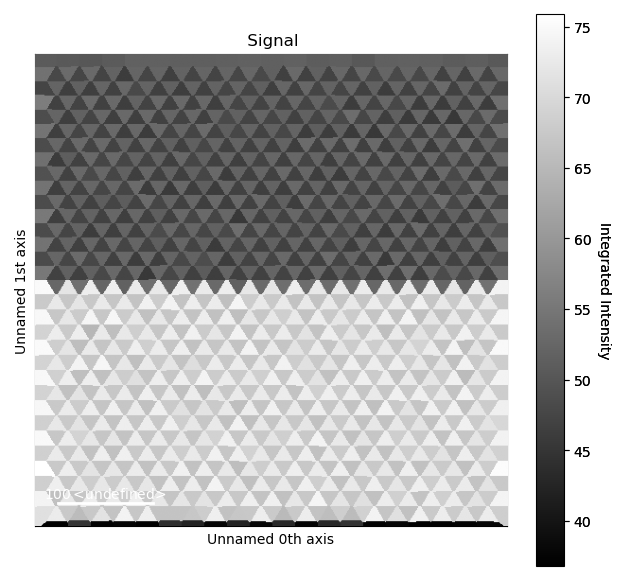
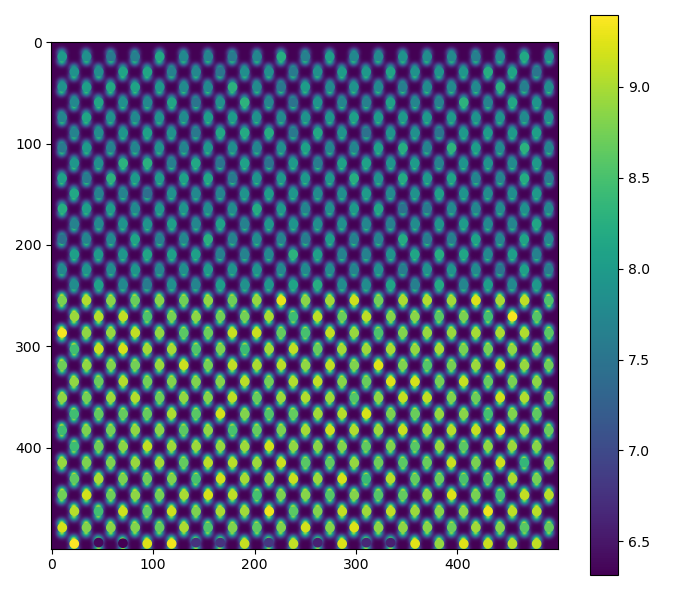
A relevant one for a heterostructure is the atom column intensity.
>>> i_points, i_record, p_record = dumbbell_lattice.integrate_column_intensity()
>>> i_record.plot()
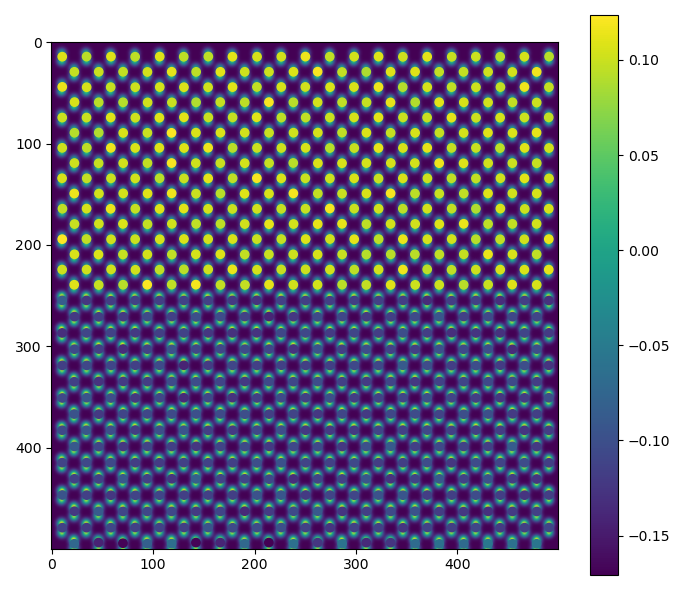
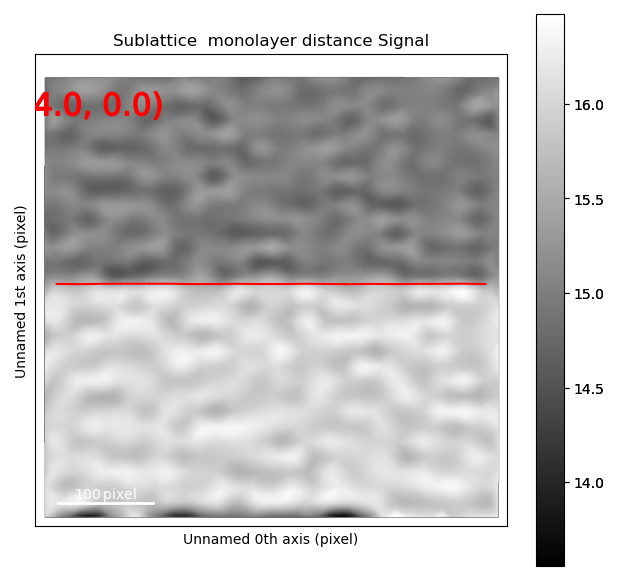
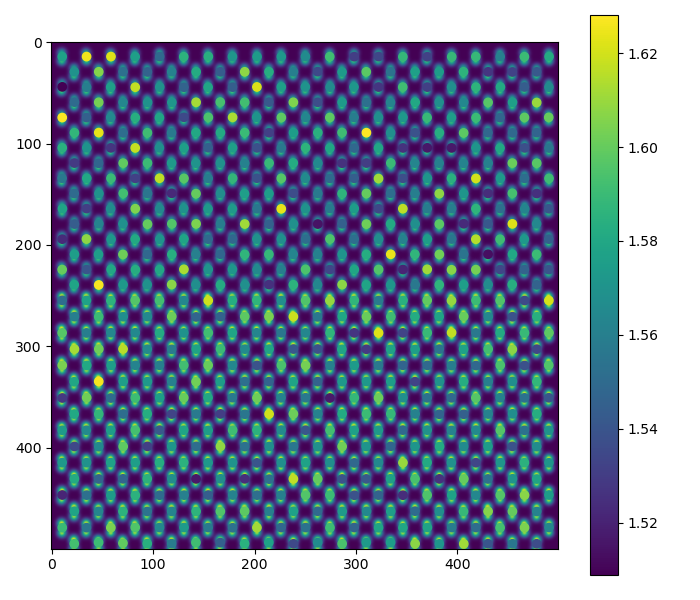
Or out-of-plane lattice plane distances
>>> sublattice0 = dumbbell_lattice.sublattice_list[0]
>>> sublattice0.construct_zone_axes()
>>> out_of_plane_direction = sublattice0.zones_axis_average_distances[2]
>>> interface_plane = sublattice0.atom_planes_by_zone_vector[out_of_plane_direction][15]
>>> s_out_of_plane_map = sublattice0.get_monolayer_distance_map([out_of_plane_direction, ], atom_plane_list=[interface_plane])
>>> s_out_of_plane_map.plot()
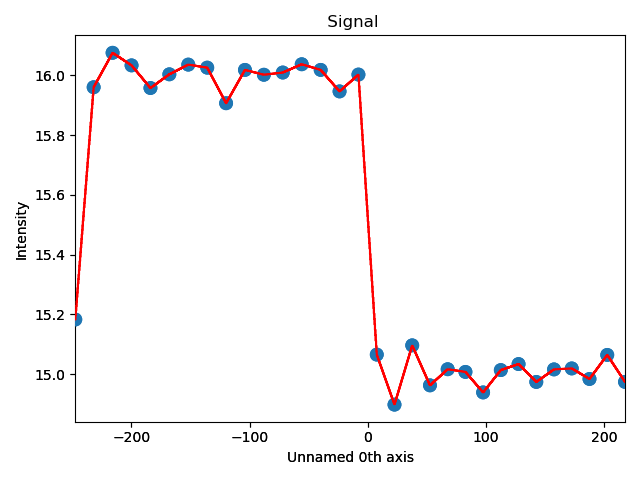
>>> s_out_of_plane_line_profile = sublattice0.get_monolayer_distance_line_profile(out_of_plane_direction, atom_plane=interface_plane)
>>> s_out_of_plane_line_profile.plot()
There are also some specific for the Dumbbell_Lattice object:
dumbbell_x, the x-position of the dumbbell, which is defined as the mean x-position of the two atoms in the dumbbelldumbbell_y, the y-position of the dumbbell, which is defined as the mean y-position of the two atoms in the dumbbelldumbbell_distance, distance between the atoms in each dumbbelldumbbell_angle, angle between the atoms in each dumbbell, in relation to the horizontal axisget_dumbbell_intensity_difference, intensity difference between the two atoms in the dumbbell
These can be visualized using various plot functions.
For dumbbell_distance:
>>> fig = dumbbell_lattice.plot_dumbbell_distance()
For dumbbell_angle:
>>> fig = dumbbell_lattice.plot_dumbbell_angle()
For the dumbbell intensity difference:
>>> fig = dumbbell_lattice.plot_dumbbell_intensity_difference()